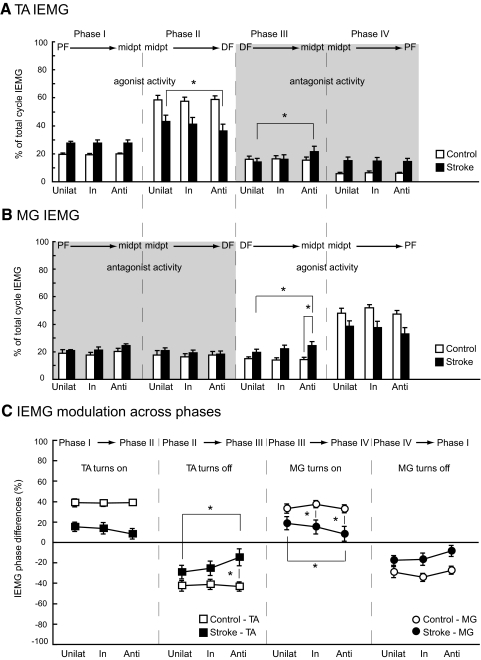
Fig. 4.
Average group EMG. Average (A) TA and (B) MG IEMG for all cycle phases, across all conditions for stroke and control groups. IEMG magnitudes are a percentage of the total cycle IEMG for each muscle. C: IEMG modulation values from phase to phase, across all conditions for stroke and control groups. Unilat, unilateral condition; In, inphase condition; Anti, antiphase condition; PF, peak plantarflexion; DF, peak dorsiflexion; midpt, midpoint range of ankle motion; TA, tibialis anterior; MG, medial gastrocnemius. Error bars, ±SE. Asterisks indicate specific significant differences from the post hoc comparisons of interaction effects.

