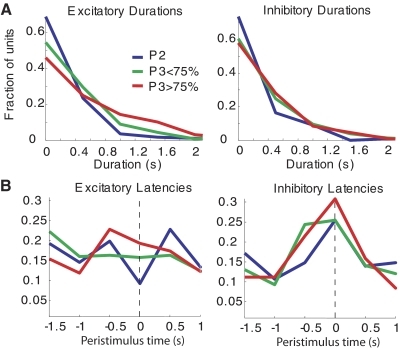
Fig. 3.
S1 response latency and duration distributions before discrimination training (P2, blue curves), at an intermediate stage of learning (P3 < 75%, green curves), and after reaching a criterion of 75% correctly discriminated trials (P3 > 75%, red curves). A: distribution of response durations for excited (left) and inhibited (right) response modulations. B: distribution of latencies (relative to the aperture beam break at t = 0) of excited (left) and inhibited (right) response modulations.

