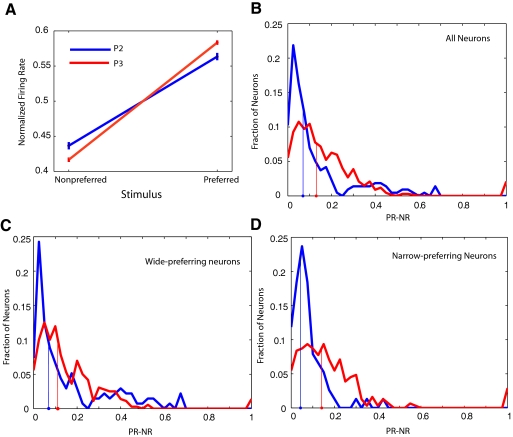
Fig. 5.
S1 single-unit aperture-width tuning curves from behaving rats get steeper with discrimination training. A: average tuning curve ± SE for phase 2 (blue) and phase 3 (red) animals. The difference between the 2 responses is greater in phase 3. B: frequency histogram of tuning-differences for all neurons recorded in phase 2 (blue) and phase 3 (red). The abscissa is proportional to the slope of the tuning curve for aperture-width. The median response-difference over all cells is indicated by the filled circles on the abscissa. C: same histogram as in B, with the analysis restricted to wide-preferring neurons. The median response-difference changes very little between phase 2 and phase 3. D: when the analysis is restricted to narrow-preferring neurons, the change in the slope of the tuning curves is significantly different in phase 2 (blue) vs. phase 3 (red).

