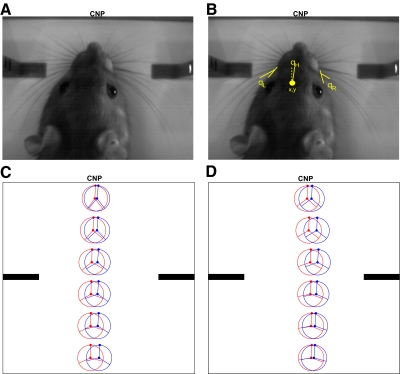
Fig. 7.
Quantifying rat behavior during learning. A: image from the discrimination chamber as the rat approaches the center nose poke (CNP) at the back of the chamber. B: the same image as in A, with the 5 behavioral variables shown. C and D: the mean behavioral trajectory before (red) and after (blue) learning. The filled circle in the center of the ring is the mean position of the rat's head, the line connecting a circle's center and edge represents the mean orientation of the rat's head, and the left and right lines represent the mean angle of the left and right whiskers, respectively, with respect to the rat's face. C: the mean trajectory for the rat with the most significant change in trajectory over learning (P < 0.001), whereas D shows the trajectories for the rat with the least significant trajectory change (P = 0.05).

