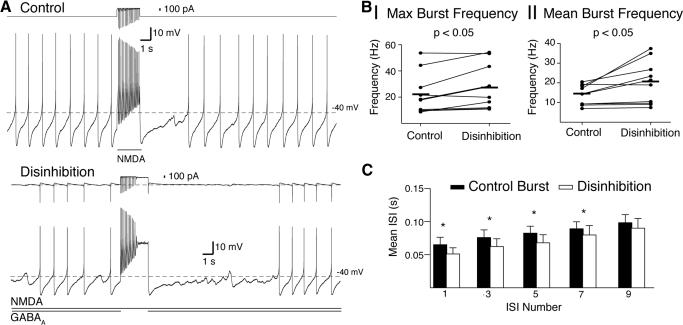
Fig. 4.
Disinhibition bursts have a greater frequency than phasic NMDA bursts of the same conductance. A: representative example of a burst produced by phasic activation of NMDA receptors (Control, top trace; gGABAA = 0; 18 Hz maximum) and by disinhibition (bottom trace; removal of gGABAA = 5.6 nS; 29 Hz maximum). The total current applied by the dynamic clamp is shown above each voltage trace. In both cases (control and disinhibition), an NMDA conductance of 20 nS was used. B: summary data show a significant increase in maximum (I) and mean (II) burst frequencies of disinhibition bursts compared with control bursts. Horizontal lines indicate the means for the sample. C: summary data show that the interspike interval (ISI) for disinhibition bursts was significantly shorter than control bursts for the 1st 7 ISIs (* = P < 0.05).

