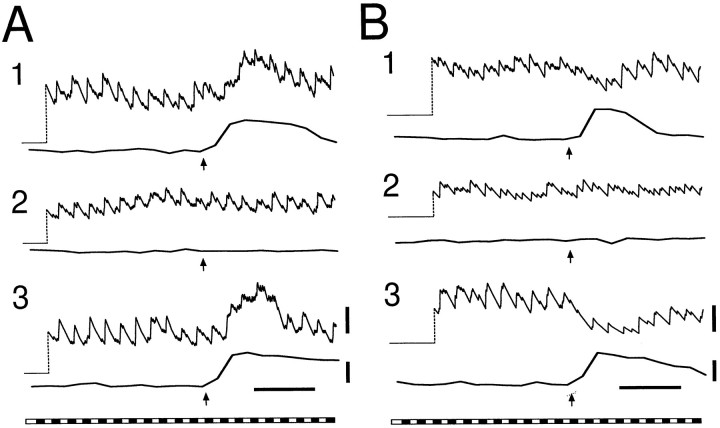
Fig. 4.
Excitatory and inhibitory modulation of neuronal activity. A frequency plot of cell activity (top trace) and glial cell Calcium Green-1 fluorescence (bottom trace) are shown for each trial. A, Excitatory modulation in an ON neuron. Spike frequency increases in those trials (1 and 3) in which [Ca2+]i in neighboring glial cells also increases. B, Inhibitory modulation in an ON–OFF neuron. Spike frequency decreases when glial [Ca2+]i increases. The peristimulus time histograms of cells in A and B are shown in Figure 2, A and B, respectively. Calibration bars are the same as in Figure 3.

