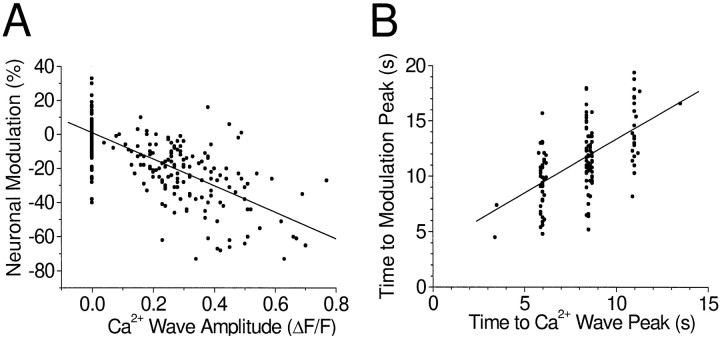
Fig. 5.
Correlation between neuronal modulation and Ca2+ increases. A, Relation between the magnitude of inhibition of neuronal activity and the amplitude of the Ca2+ wave. Points represent single trials from all cells showing significant inhibitory modulation.Points at the left of the plot (ΔF/F = 0) represent trials in which the Ca2+ wave failed to reach the neuron. Least-squares fit, R2 = 0.42.B, Relation between the time to the peak of neuron modulation and the time to the peak of the Ca2+wave. Trials in which the inhibition of activity was 25% or greater are included. The discrete Ca2+ wave times reflect the 2.55 sec acquisition period of fluorescence images. Least-squares fit, slope = 0.97, intercept = 3.6 sec,R2 = 0.30.

