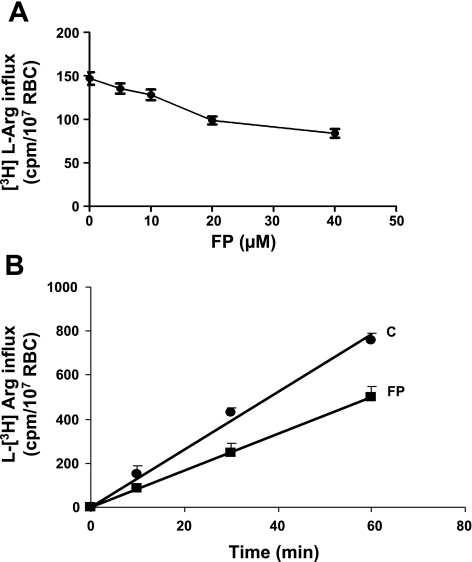
Fig. 5.
A: total influx of l-[3H]Arg (200 μM) in control RBC or RBC pretreated with increasing concentrations of FP. Influx of l-Arg was determined over 5-min incubation. Bars represent mean (5 experiments) and 95% CI. Test for trend: P < 0.001. B: time course of total l-[3H]Arg (200 μM) influx in control RBC or RBC pretreated with 40 μM FP. Results are means ± SD of 4 experiments.

