Fig. 6.
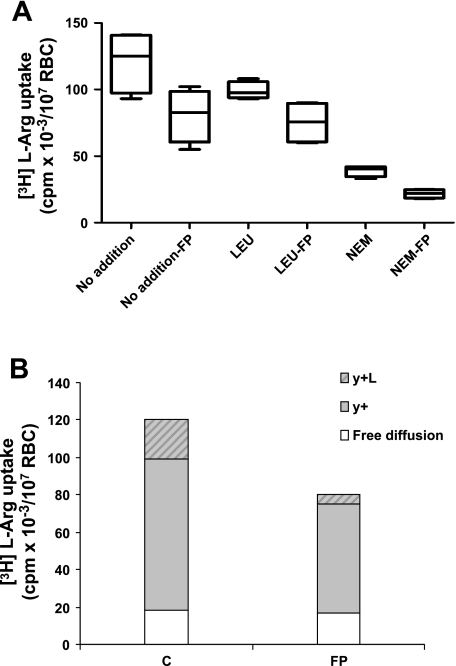
A: l-[3H]Arg uptake into control RBC or RBC pretreated with 40 μM FP (n = 4 experiments/treatment). Rates were measured in the absence (no addition) or the presence of either 1 mM unlabeled leucine (Leu) or 2 mM N-ethylmaleimide (NEM). Boxes indicate medians and interquartile ranges. Bars represent upper and lower adjacent values. P = 0.068 for each paired comparison between treatment and control by Wilcoxon signed-rank test. B: contribution of transport systems y+L and y+ and free diffusion to the total l-[3H]Arg transport in control RBC or RBC pretreated with 40 μM FP.

