Fig. 2.
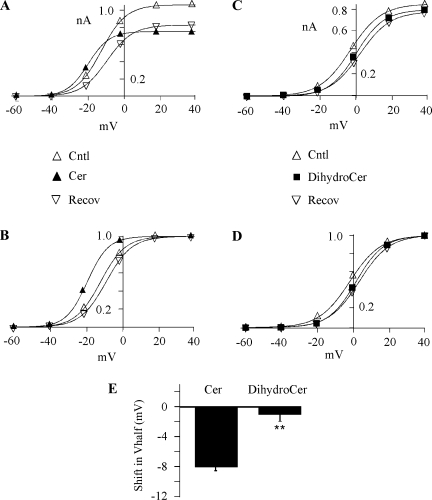
Cer hyperpolarizes HERG activation. A: activation-voltage relationships were recorded before, during, and after 10 μM Cer. Currents were measured upon repolarization to −40 mV following 5-s voltage steps ranging from −60 to 40 mV and are plotted versus the step voltage. The smooth lines represent single Boltzmann equation fits to generate half-activation voltage (V1/2) = −12, −19, and −10 mV; slope factor = 8, 8, and 8; and maximum current = 1.1, 0.8, and 0.8 nA for Cntl, Cer, and Recov, respectively. B: activation-voltage relationships shown in A were normalized to tail current generated after the +40-mV step to highlight the left shift in V1/2. The smooth lines are Boltzmann equation fits with V1/2 and slope, the same as those in A. C: activation-voltage relationship recorded before, during, and after 10 μM DihydroCer treatment. Fit parameters were V1/2 = −3, 0, and 2 mV; slope factor = 8, 8, and 8; and maximum current = 0.8, 0.8, and 0.8 nA for Cntl, DihydroCer, and Recov, respectively. D: normalized relationships (described in B) for the data shown in C. E: the negative shift in V1/2 induced by Cer. The change in V1/2 was calculated as the difference between test (either Cer, n = 21, or DihydroCer, n = 15) and Cntl, where Cntl was the average V1/2 measured before application and after Recov. **P < 0.01.

