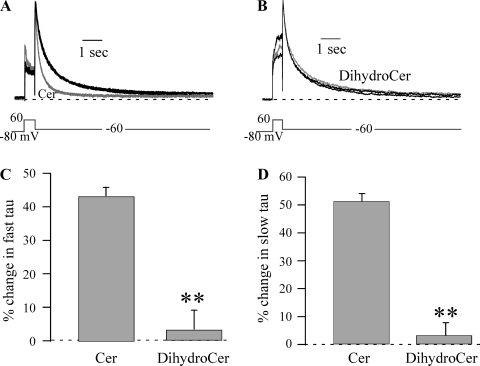
Fig. 3.
Cer speeds HERG deactivation. A: HERG current traces were normalized to peak tail current to highlight the faster deactivation induced by 10 μM Cer (gray curved line) compared with Cntl and Recov (black curved line). B: deactivation was not altered by DihydroCer (10 μM; gray curved line). C and D: %change in deactivation τ at −60 mV induced by Cer and DihydroCer for the fast (C) and slow (D) components. The %change was calculated using control deactivation τ that was the average of values measured before and after Recov from lipid application (either Cer, n = 27, or DihydroCer, n = 20). **P < 0.01.

