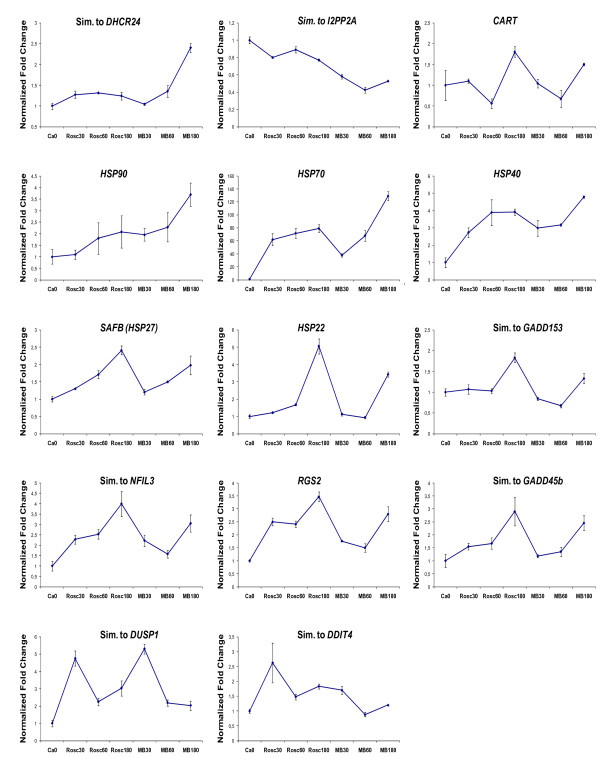
Figure 10.
Real-time qPCR analysis of genes that showed a significant differential expression in the microarray study. The genes were selected based on relevance to ischemia/reperfusion injury pathophysiology. Data are shown as means (fold change) of normalized ratios of three biological replicas (y-axis). Error bars represent standard error of the mean (SEM).

