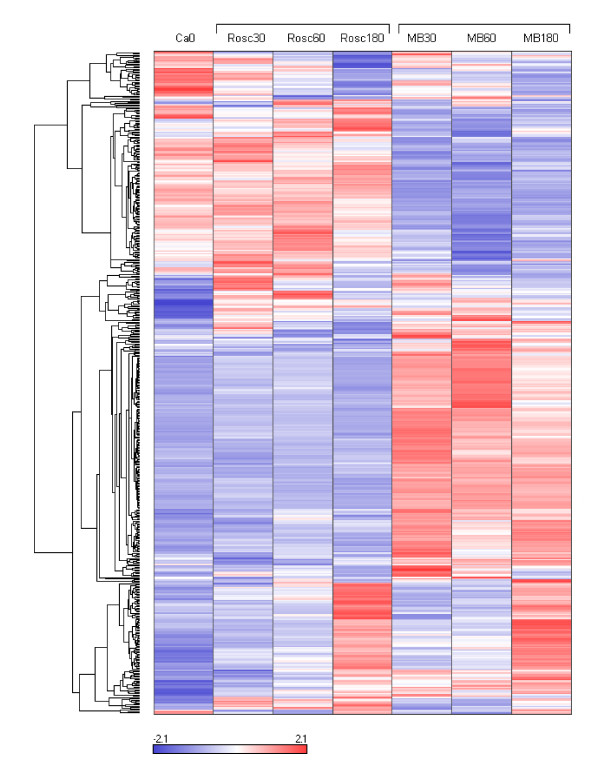
Figure 2.
Hierarchical cluster analysis of the 518 differentially expressed genes after ROSC with saline (Rosc groups) or MB (MB groups) treatment. Each row represents a gene and each column the colour coded mean value of the three animals for each group. Genes with similar expression patterns are clustered together (dendrogram on the left).

