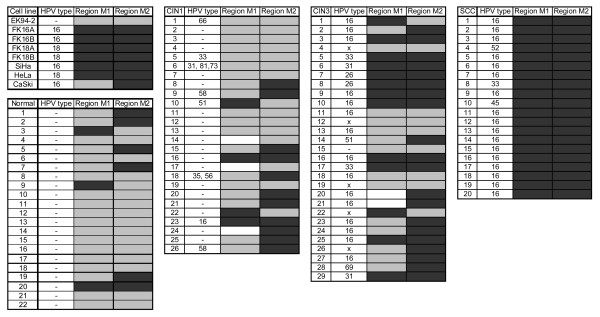
Figure 4.
Quantitative methylation-specific PCR (qMSP) results for two regions of the hTERT gene. Results of both cell cultures and cervical tissue biopsies are shown. Region M1 spans nts -317 to -262 bp, relative to the ATG and region M2 spans nt +288 to +219 bp, relative to the ATG. Black boxes indicate methylation positive, gray boxes indicate no methylation and white boxes remain undetermined. HPV status of specimens is depicted as specific HPV type present or negative (-).

