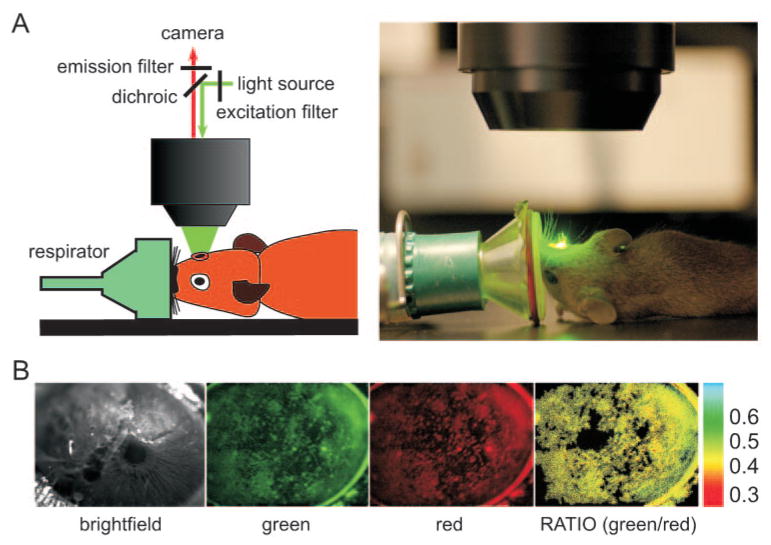
Figure 2.
Experimental setup for ratio imaging measurements of the fluorescently stained tear film. Mice were anesthetized and immobilized using a custom device with the eye under study facing upward. Tear film was stained with fluorescent indicators. Fluorescence images were recorded at two excitation or emission wavelengths. (A) Schematic (left) and photograph (right) of experimental setup. (B) Representative white light (left) and fluorescence images of mouse eyes after the addition of K+ indicator (middle), with corresponding fluorescence ratio image (right). Ratios were computed only for those pixels whose intensity in the red image was greater than an arbitrary cutoff. Pixels in the ratio image are black to indicate ratio not computed.

