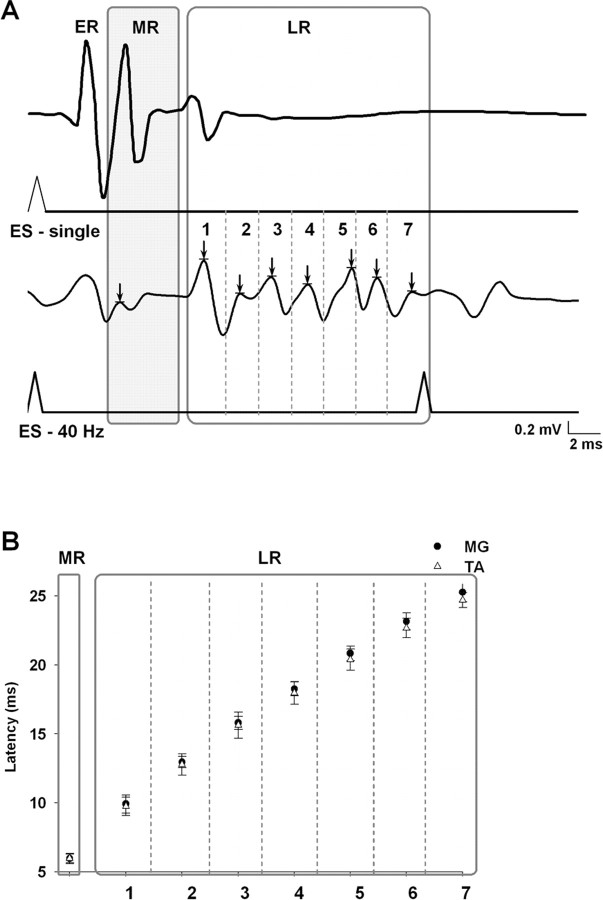
Figure 1.
A, Example of spinal cord motor evoked responses to ES at S1 in the MG muscle in a spinal cord-transected rat during standing [single shock (ES-single); top traces] compared with stepping [40 Hz stimulation (ES-40 Hz); bottom traces] on a treadmill at 7 cm/s. The potentials marked as ER (early response) have been shown to be directly evoked potentials that become prominent at higher stimulation voltages, such as that used for the single shock during standing (Lavrov et al., 2006; Gerasimenko et al., 2007). The potentials marked as MR (middle response) have the characteristics of a monosynaptic response. The potentials marked as LR (late response) show one peak in response to a single shock and a sequence of peaks (labeled 1–7) during 40 Hz stimulation. B, Latency of the MR and LR in the MG and TA muscles during stepping on a treadmill. The number of peaks (1–7; arrows) in the LR in A corresponds to the latency for each peak of the LR in B. The arrow in the shaded region marks the MR response. The mean latency of each time bin was significantly greater than the previous time bin. These delays were not significantly different between the TA and MG. The means ± SEM for each of the seven time bins were derived from evoked potentials of 10 bursts from nine rats.

