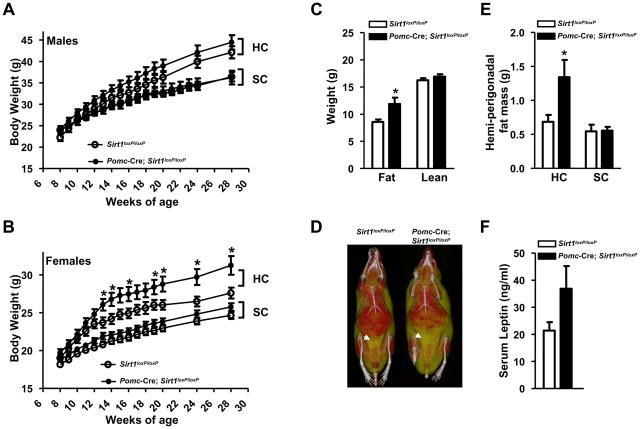
Figure 4. SIRT1 in POMC neurons is required for normal defenses against diet-induced obesity in females.
(A) Body weight curves of standard chow (SC)-fed Sirt1loxP/loxP (n=17) and Pomc-Cre, Sirt1loxP/loxP (n=20) males, high-calorie (HC)-fed Sirt1loxP/loxP (n=15) and Pomc-Cre, Sirt1loxP/loxP (n=20) males, (B) SC-fed Sirt1loxP/loxP (n=33) and Pomc-Cre, Sirt1loxP/loxP (n=37) females, HC-fed Sirt1loxP/loxP (n=14) and Pomc-Cre, Sirt1loxP/loxP (n=19) females. (C) Body composition, (D) representative microcomputed tomography images, (E) mass of hemi-perigonadal fat, and (F) serum leptin levels of Sirt1loxP/loxP and Pomc-Cre, Sirt1loxP/loxP females after 20 weeks on the HC diet (n=10–19). Mass of hemi-perigonadal fat of 28-week-old SC-fed Sirt1loxP/loxP (n=12) and Pomc-Cre, Sirt1loxP/loxP (n=12) females is shown in (E). In all figures, HC-fed mice were fed on a SC diet up to 8 weeks of age and then switched and maintained on a HC diet. In (D) red and yellow/green colors represent lean and fat mass, respectively. Arrows indicate visceral adipose tissue. Error bars represent s.e.m. Statistical analyses were done using two-tailed unpaired Student’s t test. *P<0.05.

