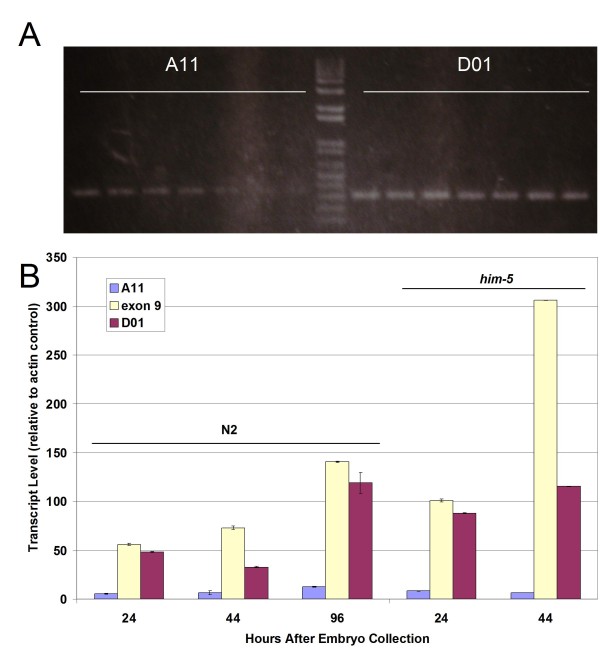
Figure 2.
Expression of sma-9 transcript variants. A. Detection of A11 and D01 transcripts using variant-specific RT-PCR over a gradient of annealing temperatures (left to right: 50°C - 55°C). The expected size of the PCR product is 330 bp for A11 and 300 bp for D01. B. Developmental profile of sma-9 transcript expression levels, as determined by qRT-PCR. Data are shown as transcript abundance relative to act-1 actin gene control, and error bars show standard deviation. See Table 1 for quantitation of transcript abundance relative to exon-9-containing control.

