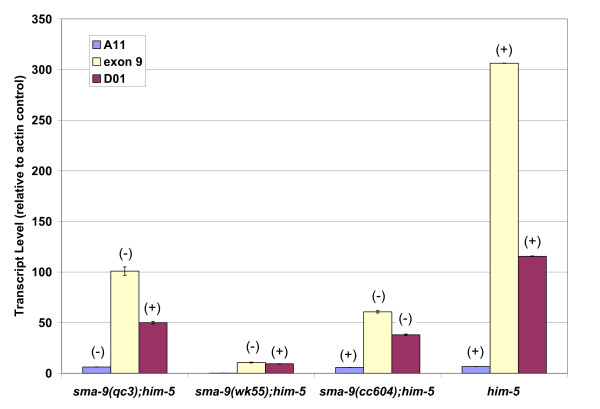
Figure 3.
Expression levels of sma-9 transcripts in mutant backgrounds. Expression levels of sma-9 transcripts as determined by qRT-PCR. Animals were collected at the L3 stage. Data are shown as transcript abundance relative to act-1 actin gene control, and error bars show standard deviation. See Table 1 for quantitation of transcript abundance relative to exon-9-containing transcripts. (-): transcript harbors a premature termination codon. (+): transcript sequence is normal.

