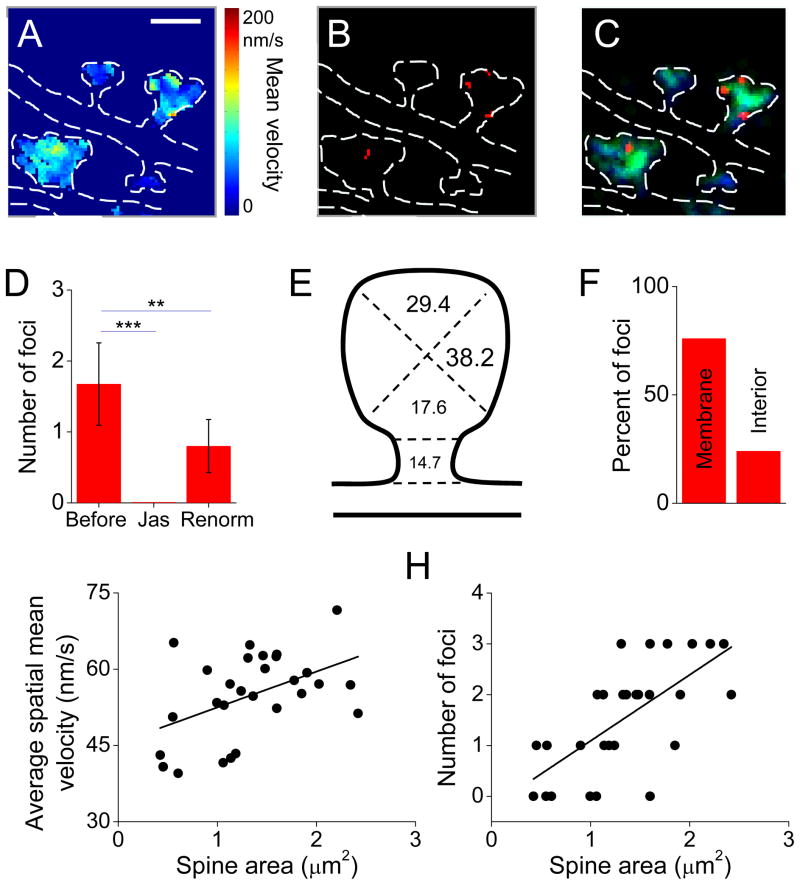
Figure 6. Widespread distribution of focal points of high velocity flow within spines.
A–C. Definition of polymerization foci. (A) Spatially averaged velocity maps were thresholded to their mean + 1.5 times their standard deviation, to produce binary maps of pixels with high average velocity (B). These were band pass filtered to exclude and combine single pixels. (C) Foci (red) superimposed on an image map showing density of both tracked (green) and untracked molecules (blue).
F. Average number of foci per spine before and after 5 min treatment with jasplakinolide, and then after recalculation of the velocity map threshold following jasplakinolide (** p < .01, *** p < .0001, repeated measures ANOVA; n = 12 spines from 5 neurons, 5 cultures).
G. Distribution of foci positions within spine subregions delineated as sketched, (n = 68 foci, 30 spines from 5 neurons, 5 cultures). The majority were at the tip and lateral regions.
H. The distribution of focal regions from E, with respect to the plasma membrane.
I. The average velocity of all pixels within individual spines (n = 32 spines, 6 neurons, 6 cultures). Solid line shows the linear regression.
J. Number of foci per spine as a function of spine area (n = 32 spines, 6 neurons, 6 cultures). Solid line shows the linear regression.

