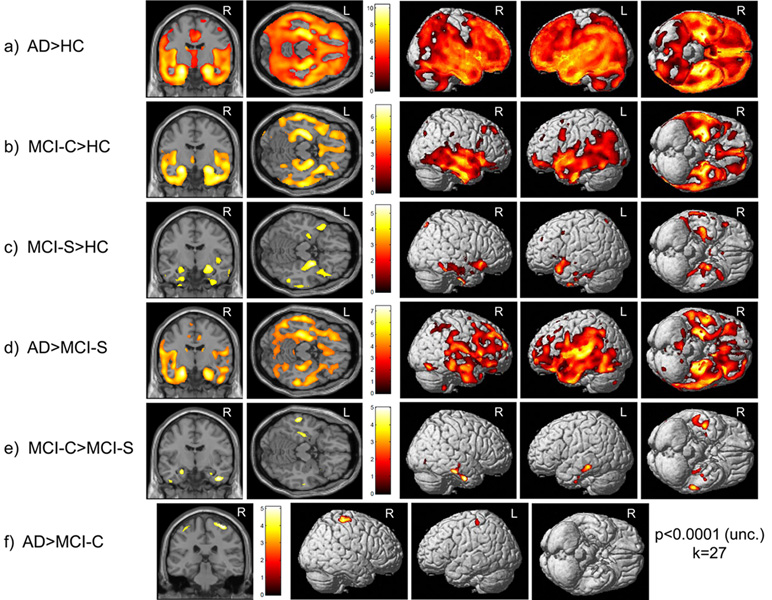
Figure 1. Group Differences in Pattern of Reduction in Grey Matter (GM) Density over 12 Months in the ADNI Cohort.
Time x diagnosis group interactions demonstrate differences in atrophy progression reflected by reduction in GM density from baseline to 1-year in the ADNI cohort (n=643*; 143 AD, 57 MCI-C, 253 MCI-S, 190 HC). Interaction contrasts are displayed at a threshold of p<0.0001 (unc.) with a minimum cluster size (k) = 27 voxels. Cross-sections in (a–e) are (0, −9, 0, coronal) and (0, −23, −16, axial), left to right. Cross-section in (f) is (34, −29, 64, coronal). (*30 participants removed from comparisons due to failed image processing)

