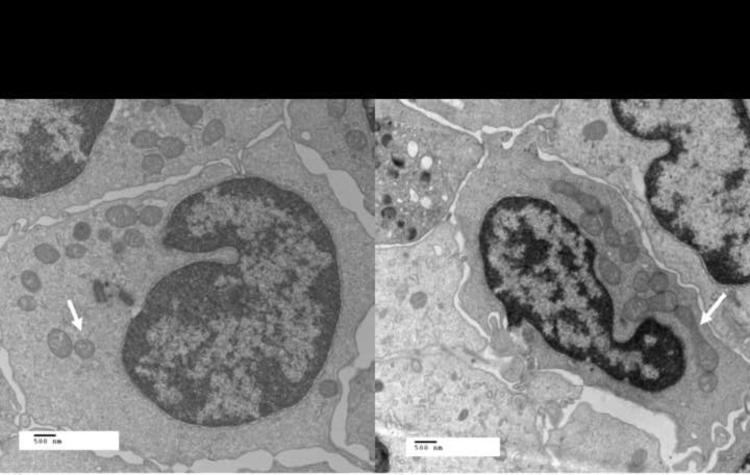
Figure 4.
Differences in mitochondrial morphology between patients with T2DM and controls. Displayed are electron microscopy images (original magnification 12,000×, print magnification 23900× @8 in, 500 nm scale) showing that the mitochondria of Type 2 diabetics (a) are generally smaller and rounder compared to non diabetic controls (b). White arrows point to representative mitochondria in each image.

