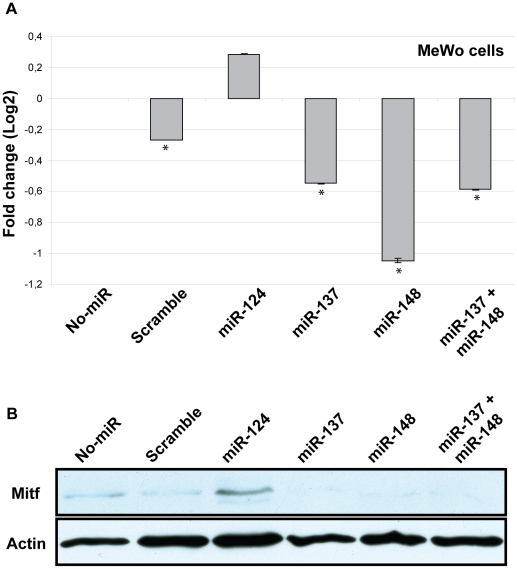
Figure 4. Effects of miRNAs on endogenous MITF.
A. Expression of human MITF mRNA in MeWo cells transfected with miR-124, miR-137, miR-148 or miR-137 and miR-148 combined. The figure shows average expression levels of three replicates for each sample relative to untreated cells (No-miR). Negative control is a scramble miRNA sequence (scramble). Statistically significant difference between untreated cells and treated cells are shown with an asterisk (T-test, 95% confidence level). P-values are: Scramble = 0.0396; miR-124 = 0.2228; miR-137 = 0.0069; miR-148 = 0.0051; miR-137+148 = 0.0051. B. Western blot analysis on MITF protein levels in MeWo cells, when transfected with miR-124, miR-137, miR-148 or miR-137 and miR-148 combined.

