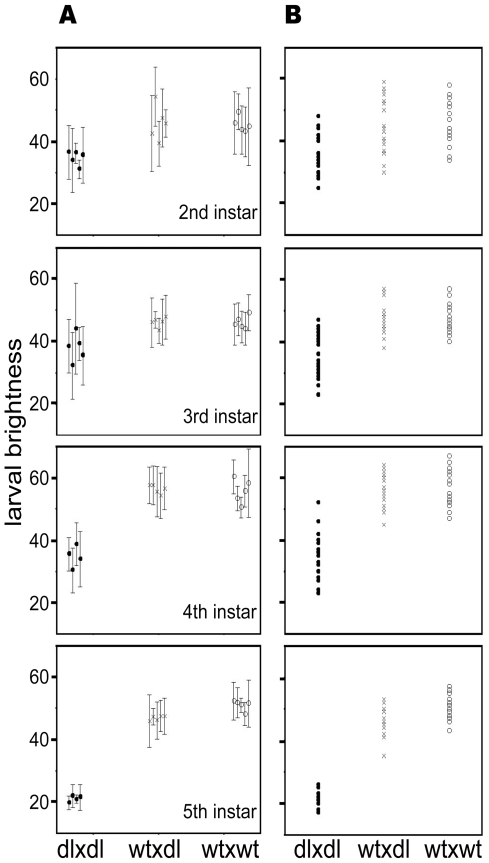
Figure 2. Graphical representation of B-values of offspring from three types of parental cross.
a. Average B-values (± SD) of offspring from three types of parental cross. Each cross is represented by five families arranged vertically by instar. b. Scatter plot to show overlap and spread of B-values for individuals from the families of the three types of parental cross.

