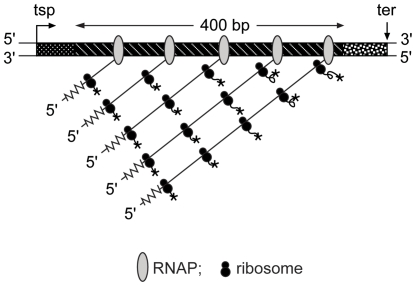
Figure 3. Scheme for coupled gene transcription/translation.
The diagram represents a snapshot of an ORF of a population-average cell synthesizing protein. The size of the coding region (400 base-pairs) is close to that of rpsL (375 base-pairs) and rplL (393 base-pairs). The transcription start point (tsp), the 5′- and 3′-nontranslated regions and the terminus (ter) of transcription are indicated; RNAPs and ribosomes are not drawn to scale. RNAPs are spaced at one RNAP per 80 base-pairs and ribosomes at one ribosome per 80 nucleotides. The nascent polypeptide chains are shown as curly lines ending in an ‘*’. The instantaneous value of the specific synthesis rate of the encoded protein is the product of the number of ribosomes translating transcripts of the ORF and the polypeptide chain elongation rate (see equation (9)) The numbers of transcripts were measured by qRT-PCR and the numbers of associated proteins were deduced by means of the parameter n R(i)/tr(i), the average number of ribosomes per transcript, which is by given by equation (18). The polypeptide chain elongation rate is given by equation (13). There is an upper limit to the numbers of transcripts and their associated ribosomes per ORF; for the example shown above the limit is five or so transcripts and fifteen or so ribosomes.

