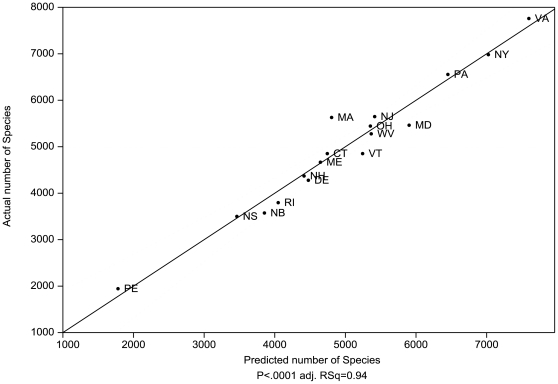
Figure 2. Actual species diversity plotted against the predicted diversity using the model with the highest R2 and lowest AICc (adj. R2 = 0.94, P<0.0001).
This model is for all-species based on four factors. The model equation is Species Diversity = 4205.77+417.62 * number of geology classes +0.0006* hectares of calcareous bedrock −0.0004*degree latitude +0.129* elevation range. Dashed line indicates 95% confidence interval. See Figure 1. for state and province legend.

