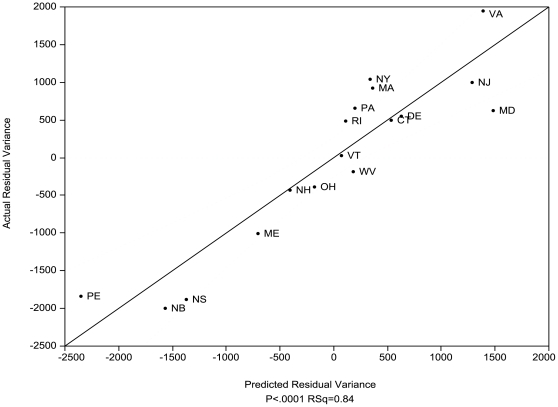
Figure 3. Residual variance in species diversity after area was factored out.
The figure shows the actual species numbers plotted against the predicted variance for the model with the highest R2 and lowest AICc (adj. R2 = 0.84, P<0.0001) for all species based on three factors: number of geology types, latitude and the amount of acidic sedimentary bedrock (negative). Dashed line indicates 95% confidence interval. See Figure 1. for state and province legend.

