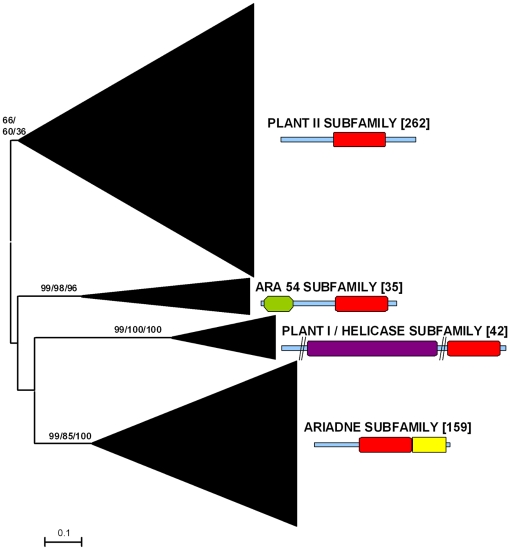
Figure 1. Basic result for the general analyses including 498 plant RBR sequences.
The main branches that correspond to the four subfamilies are indicated. Numbers above those branches correspond to bootstrap support, in percentages. The three numbers correspond to Neighbor-joining (NJ), maximum parsimony (MP) and maximum likelihood (ML) analyses (order: NJ/MP/ML). Numbers in brackets refer to the number of protein sequences which are included in a branch. The typical structures of the proteins in the subfamilies are also indicated (red: RBR supradomain; green: RWD/GI domain; purple: DEAD/DEAH helicase domain; yellow: Ariadne domain). The slashes in the Helicase-containing protein are included to reflect that these proteins are usually much longer than shown here and two regions have been deleted. See ref. [5] for further details of these structures.

