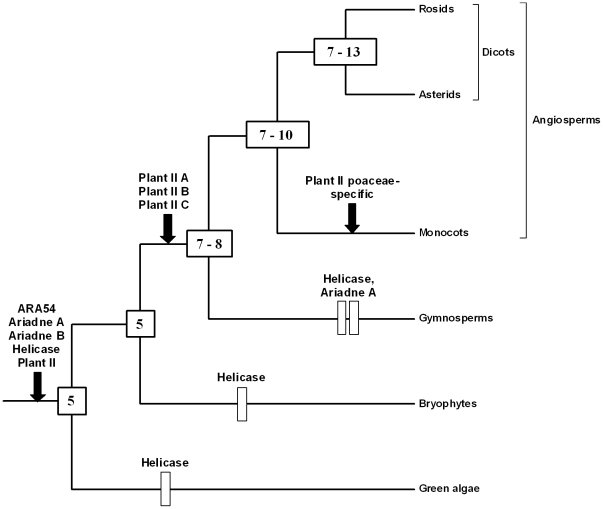
Figure 3. The most parsimonious hypothesis to explain the progressive diversification of plant RBR genes.
This figure summarizes how this family may have diversified, according to the available data. Rectangles correspond to gene losses and arrows to gene emergences. The numbers in the internal nodes (boxes) correspond to the genes deduced to exist at that particular time. Ambiguities are due to the difficulties in establishing when lineage-specific duplications occurred (see text).

