Figure 3.

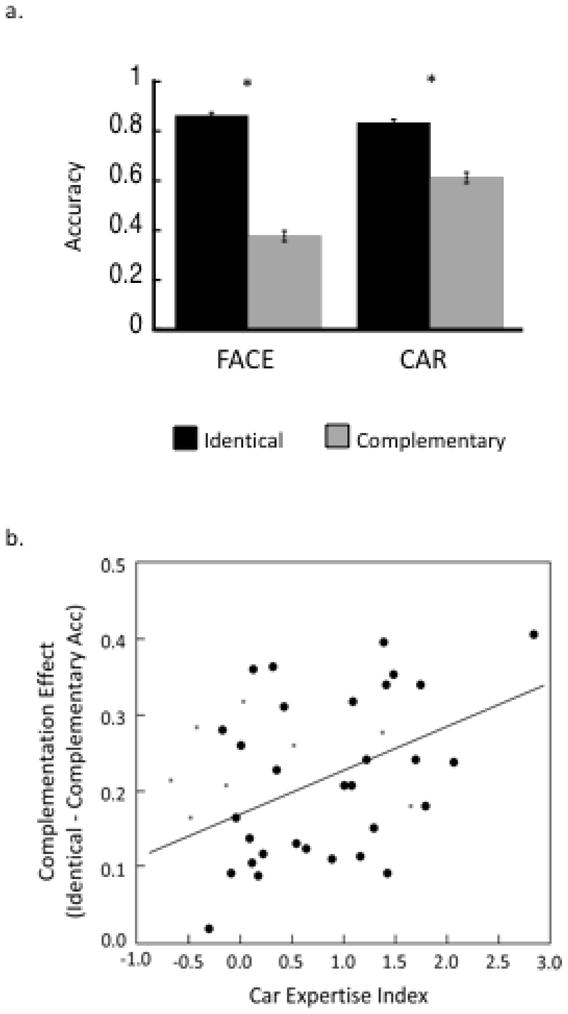
Experiment 1 results (N=39). (a) Mean accuracy values for the same-different matching of identical and complementary faces and cars. Error bars represent the standard error of the mean. (b) Correlation plot showing the relationship between the Complementation Effect (accuracy on Identical trials – accuracy on Complementary trials) in the upright car condition and the Car Expertise Index (Car d′ – Bird d′). Grey squares represent the subset of the population with Bird d′ scores greater than 1 (n=8 out of 39). The linear regression is calculated considering the remaining participants (n=31), and shows a significant positive correlation (r=.42, p<.05).
