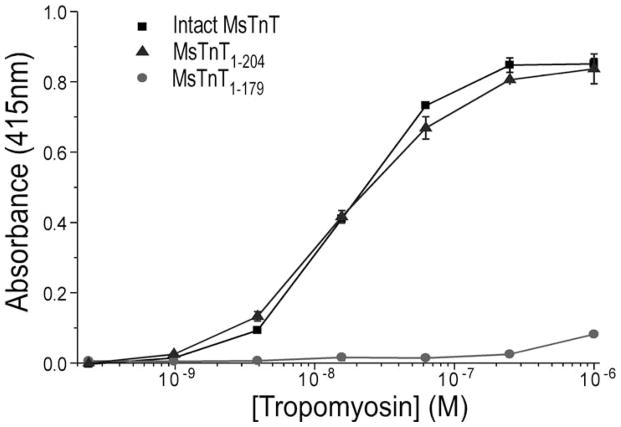
Fig. 4. Mapping of the T2 region Tm-binding site.
Intact MsTnT, MsTnT1–179, and MsTnT1–204 fragments (Fig. 1) were examined for Tm-binding in ELISA protein binding experiments. The binding curves showed that whereas MsTnT1–179, containing the T1 region Tm-binding site had rather weak binding to Tm (P<0.01), MsTnT1–204 exhibited high affinity binding to Tm similar to that of intact MsTnT. Data are plotted as mean ± SD. In contrast to the normalized binding curves of the N-terminal truncated cardiac TnT fragments shown in Fig. 2 based on their similar maximum binding to Tm, the binding curves here were plotted from actual absorbance to demonstrate the significantly lower maximum Tm-binding of MsTnT1–179 than that of intact MsTnT and MsTnT1–204 in the solid phase binding assay.

