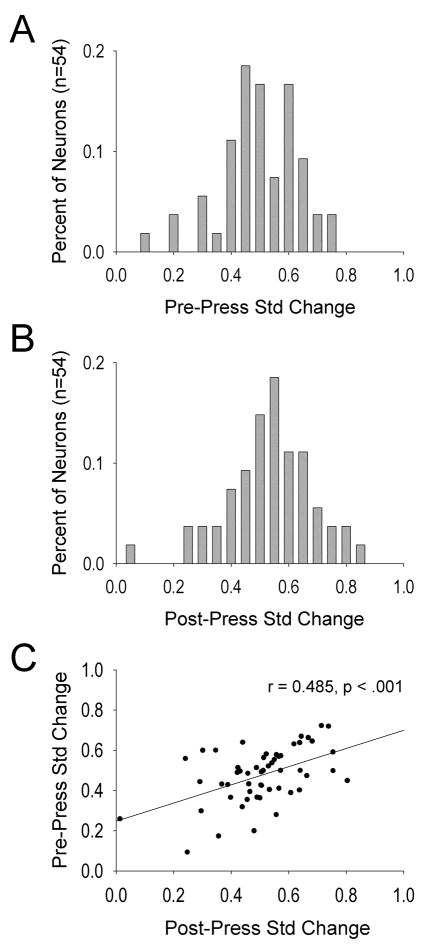
Figure 2.
Frequency distributions of standardized change (B/A+B) in firing rates during the pre-press (A) and post-press (B) firing windows. Values greater than or less than 0.5 reflect increases or decreases from baseline firing rate, respectively. Values of 0.5 indicate no change from baseline firing rate. C. Pre-press and post-press standardized changes in firing rate for all neurons comprising panels A and B.

