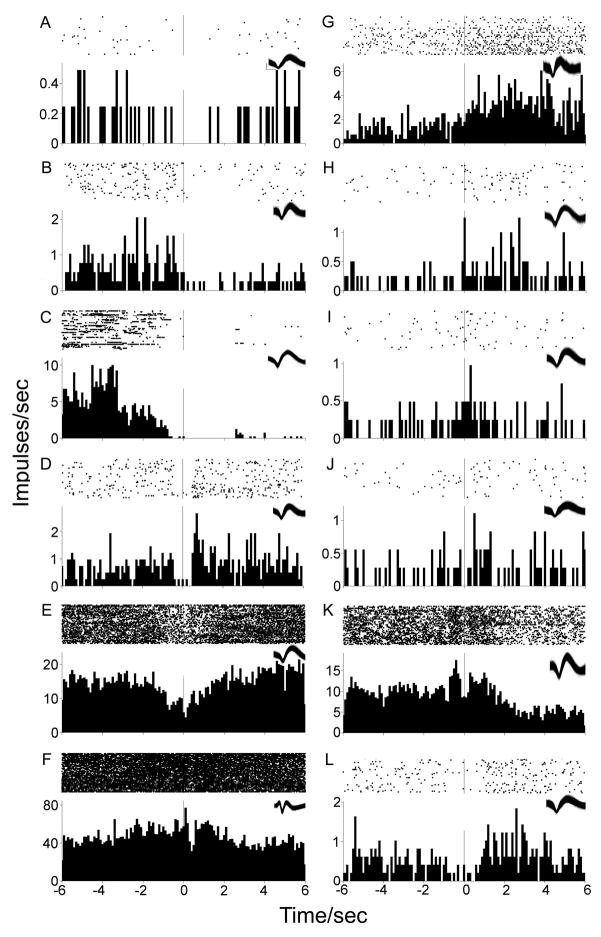
Figure 3.
Examples of phasic firing patterns. Each PETH is centered (abscissa time 0, vertical line) at the cocaine-reinforced lever press in 100 msec bins with the raster display above it. X-axes span twelve seconds total, six seconds prior to and following the lever press. Y-axes display average firing rate (impulses/sec). Waveforms of each neuron are presented in the top-right inset of each histogram. Scale of calibration bar (panel A inset) applies to all waveforms: 160 μsec; 0.2 mV.

