
Figure 10. Correlation between orientation and spatial frequency selectivity and excitation.
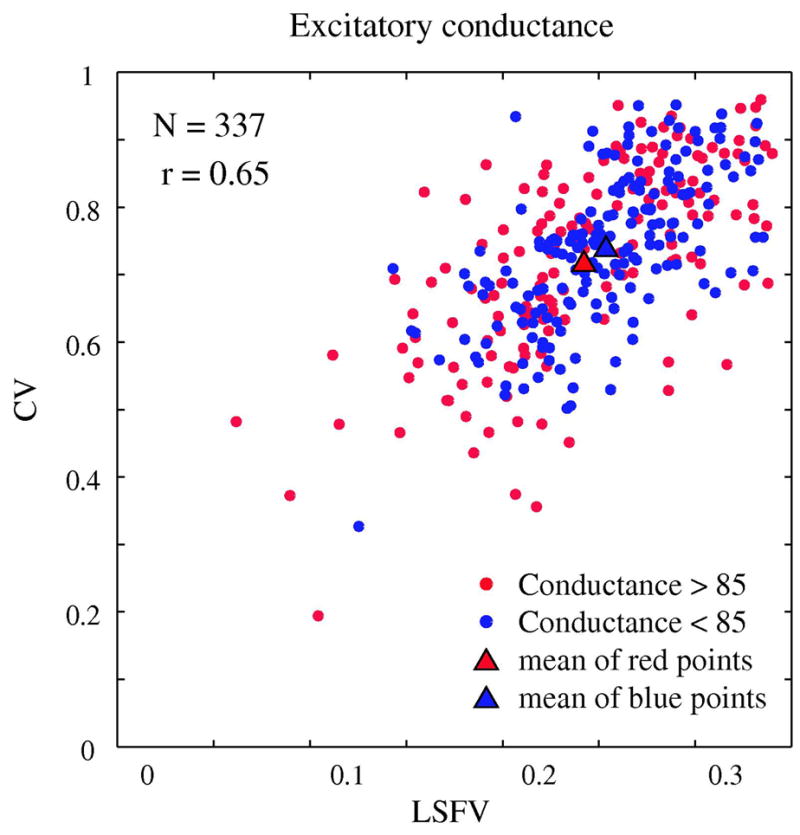
The correlation pattern of orientation and spatial frequency selectivity for a randomly selected subset (N=337) of model simple cells. Each cell is marked by a color that indicates its average excitatory conductance across the 15 experimental runs that were used to generate the two tuning curves for orientation and spatial frequency. There is no clear pattern of clustering of cells with low or high average excitatory conductance.