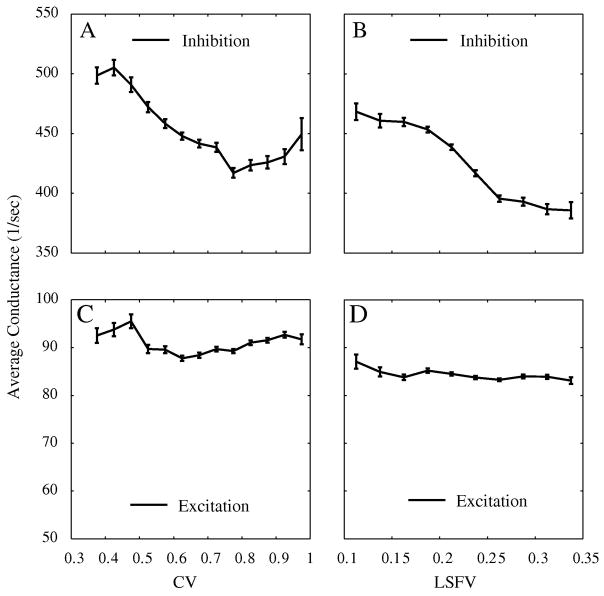
Figure 8. Inhibition, excitation and selectivity for simple cells.
Plots of mean inhibition and excitation vs circular variance and LSFV. Standard errors indicated by the error bars. There is a correlation between simple cells’ selectivity and the inhibition they received in both orientation (A) and spatial frequency (B) domain. However, there is no such relationship between simple cells’ selectivity and their excitation (C and D). The mean excitation and inhibition value for each model neuron is the average over time and over the responses to the eight stimuli used to obtain a tuning curve in each domain.

