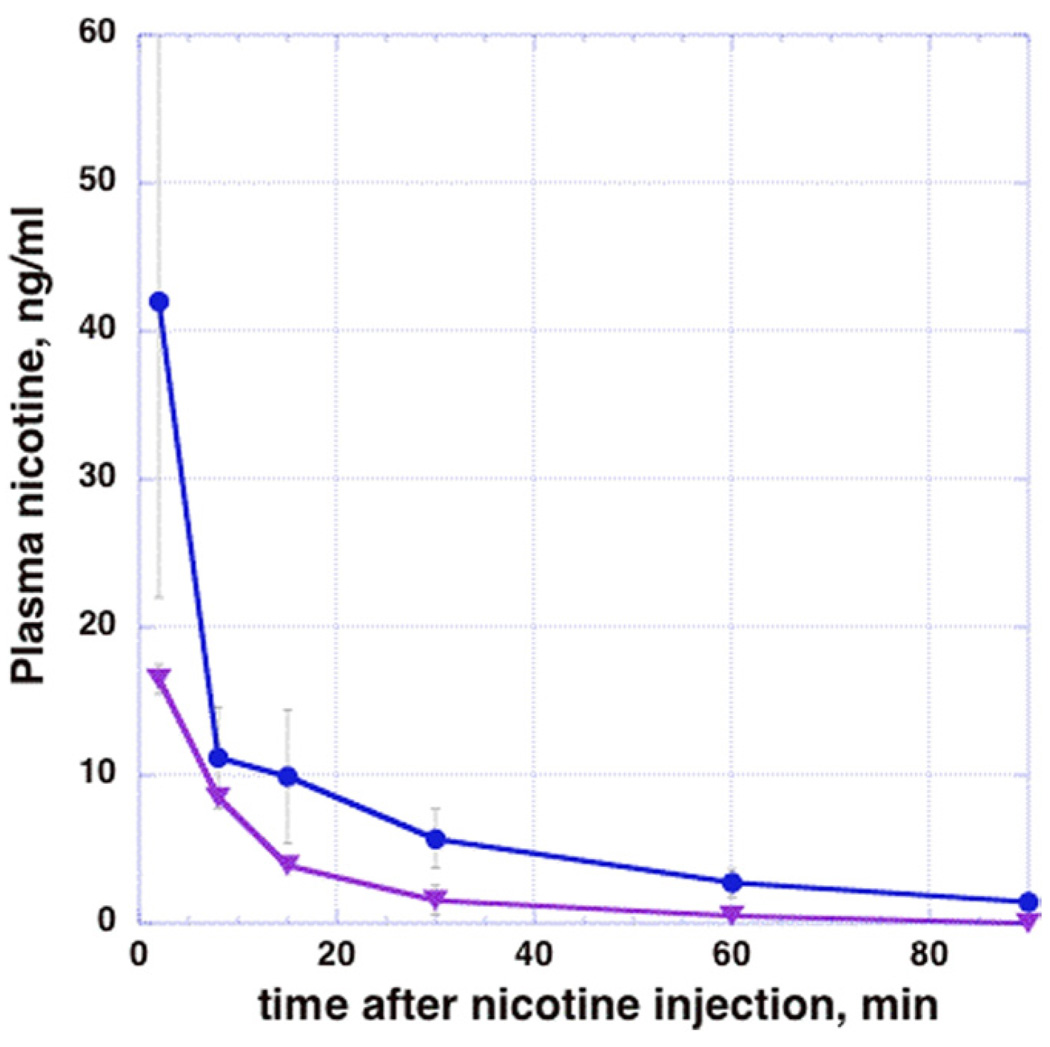
Figure 2.
Dose-related plasma levels of nicotine in female baboons. The circles (blue line) depictmeannicotine plasma levels in four animals injected with .03 mg/kg nicotine IV. The triangles (purple line) depict nicotine levels in two animals injected with .015 mg/kg nicotine. Error bars represent SD of 2–4 studies/time point.

