
Figure 3.
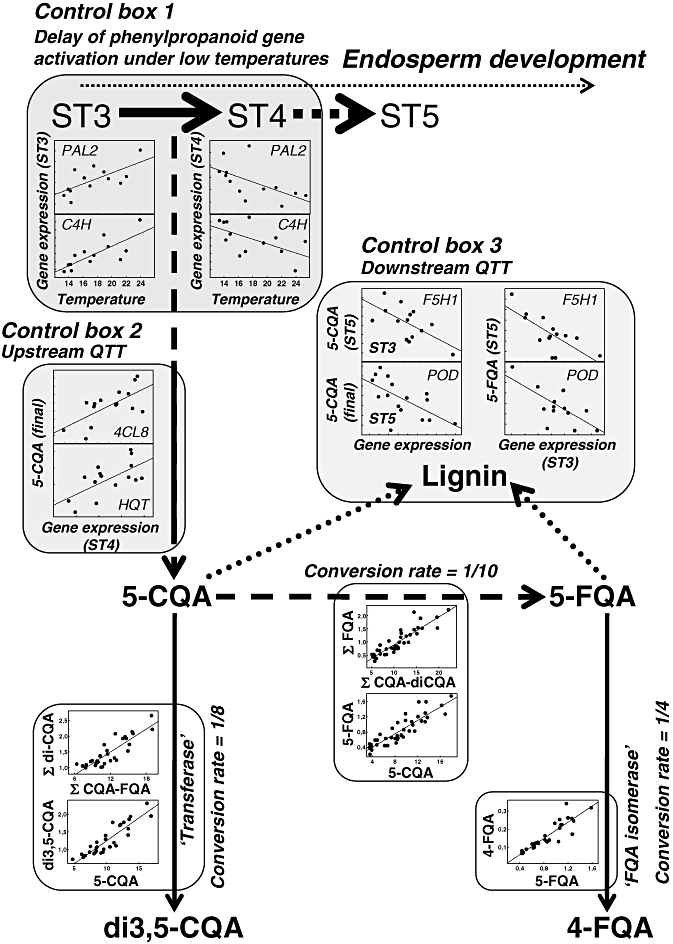
Simplified diagram showing the three ‘control boxes’ of chlorogenic acid (CGA) biosynthesis evidenced in the developing coffee seed: delay in core phenylpropanoid gene activation caused by low temperatures (control box 1), and upstream (2) and downstream (3) Quantitative trait transcripts (QTTs) for 5-CQA and 5-FQA synthesis. Correlations between temperature and transcript abundances, as well as between transcript abundance and metabolite contents, were significant at P < 0.05. The isomerization steps characterized by a constant conversion rate over locations and time are also presented. Conversion rates were estimated from the slope of regression lines (R > 0.8; P < 0.01).