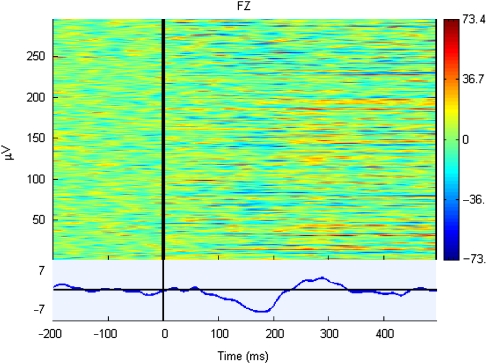
Figure 3.
Sample ERP image for a set of difference waves (subject #1), formed by subtracting the preceding standard from each deviant. Each difference wave corresponds to a horizontal line, with color indicating amplitude (red positive and blue negative) over the time range indicated on the horizontal axis. The mean amplitude of the difference wave is shown in the lower panel.

