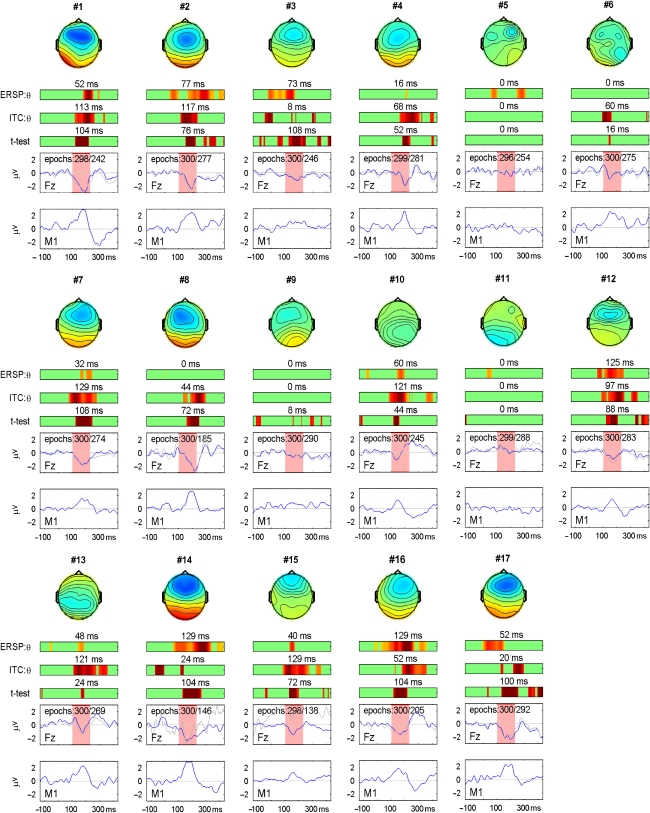
Figure 5.
Results for individual participants (numbered) with 2D head plots indicating mean amplitudes during the interval 100–230 ms, color-range from −3 μV (blue) to +3 μV (red). Lowest panels show difference waveforms for each participant showing mean amplitude in μV on y-axes and time in ms on x-axes. Blue line for FZ panel shows data after removal of components with high variance, gray line shows original data after removal of trials with activity outside the range ±75 μV. Number of epochs is shown for blue line, then gray line. Color bars show regions of significance at .05 level for (a) t-test comparing mean amplitude with zero; (b) ITC relative to baseline, and (c) ERSP increase relative to baseline. The longest consecutive period of significance in the interval 100–232 ms post-onset is shown above each color bar.

