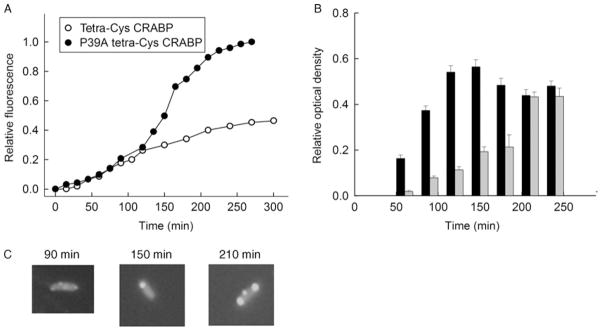
Fig. 2.
Soluble and aggregation-prone variants of CRABP show different patterns of bulk FlAsH fluorescence. (A) Time evolution of the expression and aggregation of P39A tetra-Cys CRABP (filled symbols) and the expression of tetra-Cys CRABP (open symbols), monitored by fluorescence at 530 nm (excitation 500 nm). (B) Partitioning of P39A tetra-Cys CRABP protein between soluble (black bars) and insoluble (light gray bars) cytoplasmic fractions. (C) Examples of fluorescence microscopic images of the P39A tetra-Cys CRABP-expressing cells, taken at the indicated times after induction of protein synthesis with IPTG. Parts of the figure are reproduced from Ignatova and Gierasch (2004).

