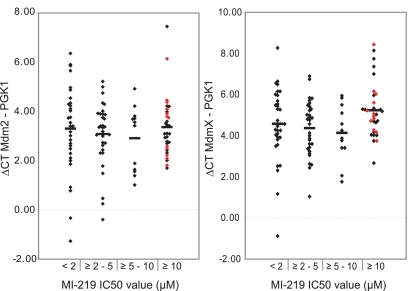
Figure 4.
The mRNA levels of MDM2 and MDMX do not correlate with MI219 IC50 values. Normalized expression levels of MDM2 and MDMX mRNA were measured in cDNA made from RNA from FACS-sorted AML blasts. Displayed are δ Ct values (Ct mean MDM2 or MDMx − Ct mean PGK1) grouped by MI219 IC50 values as indicated. Red diamonds represent AML blasts with mutated p53.

