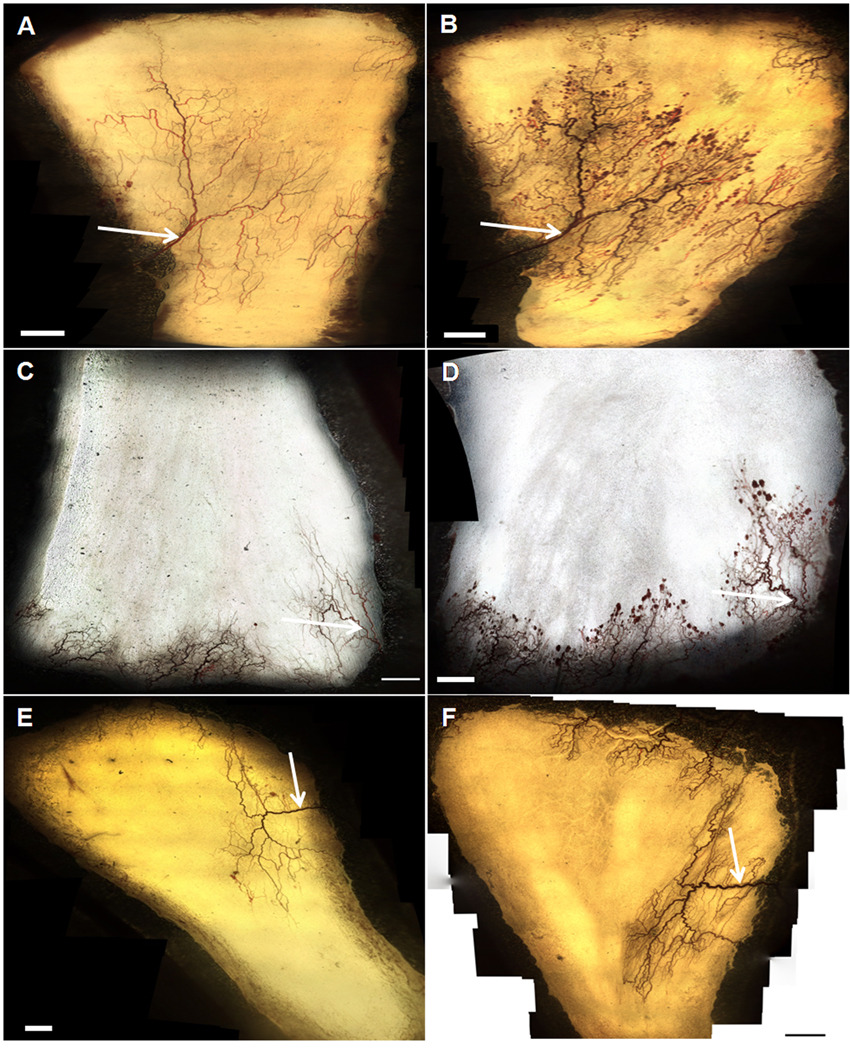
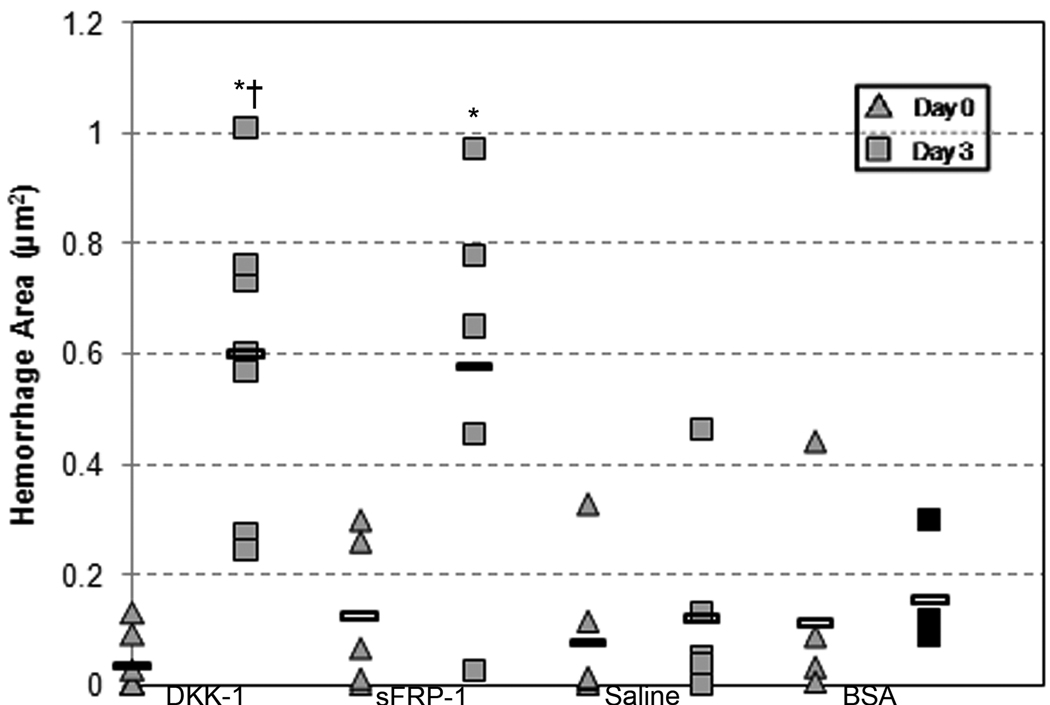
Figure 1.
A–F: Representative intravital microscopy images (4×) of a rat mesentery window. A (DKK-1), C (sFRP-1), E (Saline): Vasculature of an entire network at the time of surgery. B (DKK-1), D (sFRP-1), F (Saline) Vasculature of the same network three days following surgery. Arrows indicate venules measured for diameter changes. Scale bar = 1mm. G: Hemorrhage area in mesenteric windows for DKK-1 (n=7), sFRP-1 (n=5), saline (n=6) and BSA (n=4) treatments. Each data point represents a window, and each column represents a particular treatment and day. Rectangular bars indicate the mean for each column. * - Significant compared to respective Day 0 treatment mean with p < .05. † - Significant compared to Saline at Day 3 with p < .05.


