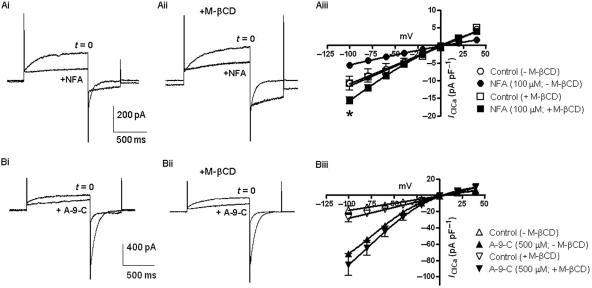
Figure 3.
Effect of NFA and A-9-C in the presence of M-βCD. (A) Effect of 100 µM NFA on IClCa in the absence and presence of 3 mg mL−1 M-βCD. (Ai and Aii) Representative traces. (Aiii) Effect of NFA on IClCa amplitude recorded at different potentials, using the reversal protocol in Figure 1G, in the absence and presence of 3 mg mL−1 M-βCD (see insert). *P < 0.05 for paired Student's t-test comparisons between data acquired prior to and post-application of NFA at the indicated step. (Bi and Bii) Representative traces showing effects of 500 µM A-9-C in the absence and presence of 3 mg mL−1 M-βCD, respectively. (Biii) Mean effect of A-9-C on IClCa amplitude recorded at different potential, using the reversal protocol in Figure 1G, in the absence and presence of 3 mg mL−1 M-βCD (see insert). Each point comprises data from at least four cells with error bars depicting SEM.

