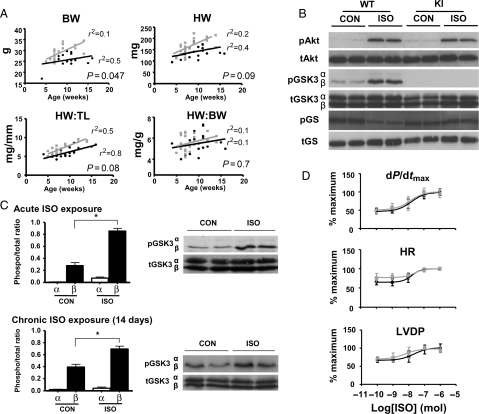
Figure 1.
Developmental growth and baseline characteristics of WT (GSK-3α/βSer-21/9) and KI (GSK-3α/βAla-21/9) mice. (A) Heart weight (HW), body weight (BW), and tibia length (TL) measurements in a cohort of male mice between 5 and 15 weeks of age. n = 25 (grey square, KI) and n = 20 (black circle, WT). (B) Representative western blots of isolated hearts perfused for 15 min with ISO (10−8 mol) or control (Krebs–Henseleit buffer). (C) GSK-3α/β phosphorylation profile in response to acute and chronic ISO exposure. Representative immunoblots are shown with quantitative analyses of repeat experiments expressed as the ratio of phosphorylated to total protein. Data expressed as mean ± SEM (n = 4), *P < 0.05 vs. control. (D) Concentration–response relationship for isolated hearts perfused with ISO; dP/dtmax, contractile performance; HR, heart rate; LVDP, left ventricular developed pressure. Black circle, WT; grey square, KI, n = 6/group, NS between genotypes in all categories.

