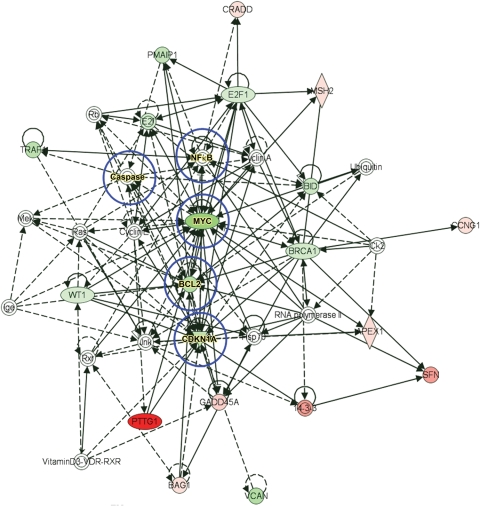
Figure 6.
IPA™ functional network as generated by focus molecules. Selected upregulated (shades of red) and downregulated (shades of green) candidate molecules, obtained from an RT2-PCR p53 pathway array, were used as focus molecules to generate the functional network. Candidate molecules not shaded by any colour were generated by the network from its knowledge base. IPA-predicted nodal molecules, which can regulate the entire network, are circled in blue. Solid arrows between molecules depict experimentally proven relationships. Dashed lines depict inferred interactions based on experimental evidence.

