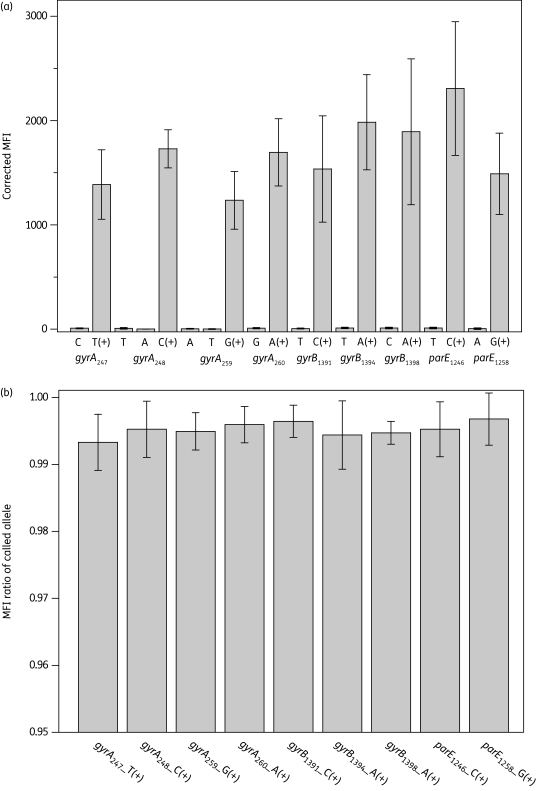
Figure 3.
Reproducibility of the Luminex assay in five independent tests with Salmonella Typhi CT18. (a) Raw data of average corrected MFI values (MFI minus the MFI of bead control). Error bars indicate the standard deviation. (b) Ratios of MFIcalled allele/(MFIwild allele + MFImutant allele). The average ratio for the called allele is shown, with error bars indicating the standard deviation.

