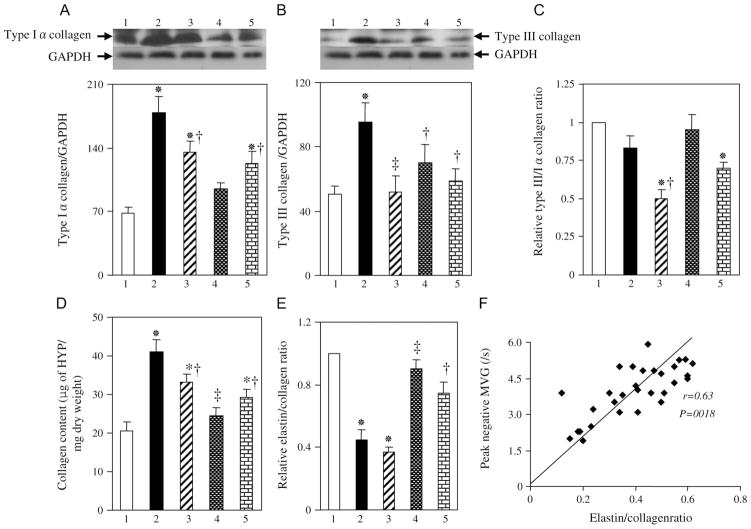
FIGURE 2.
Collagen and elastin expression in the LV of DS rats in the 5 experimental groups at 19 weeks of age. A, B, Immunoblot analysis of type Iα (A) and type III (B) collagen in the LV of rats of the control (1), HF (2), HYD (3), OLM + AZE (4), or APO (5) groups. Representative blots and densitometric analysis of the collagen to GAPDH ratio are shown in the upper and lower panels, respectively. C, Type III:Iα collagen ratio determined from immunoblots similar to those shown in (A) and (B). Data are expressed relative to the value for the control group. D, E, Collagen content (D) and the ratio of elastin to collagen contents (E) of the LV. Data in (D) are expressed as micrograms of hydroxyproline (HYP) per milligram of tissue dry weight, whereas those in (E) are expressed relative to the value for the control group. F, Relation of peak negative MVG to the elastin to collagen ratio for 6 rats of each group. Quantitative data in (A) to (E) are means ± SEM for 6 rats per group. *P < 0.05 versus control group; †P < 0.05, ‡P < 0.01 versus HF group.

