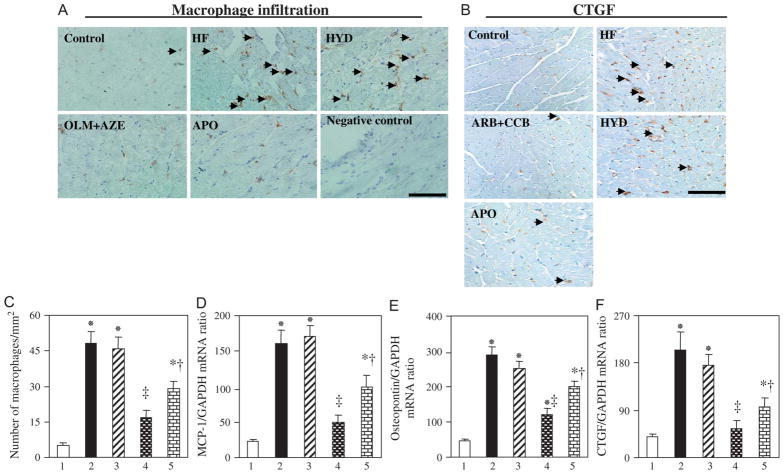
FIGURE 4.
Macrophage infiltration and expression of CTGF, MCP-1, and osteopontin in the LV of DS rats in the 5 experimental groups at 19 weeks of age. A, C, Representative immunohistochemical staining for macrophage infiltration in the LV is shown in (A). A section from an HF rat stained with nonimmune immunoglobulin G instead of primary antibodies is shown as a negative control. Arrowheads indicate macrophages. Scale bar: 100 μm. Quantitation of the number of infiltrated macrophages per square millimeter is shown in (C). Data are means ± SEM for 6 rats of each group. *P < 0.05 versus control group; †P < 0.05, ‡P < 0.01 versus HF group. B, Representative immunohistochemical staining for CTGF in the LV. Arrowheads indicate immunoreactivity. Scale bar: 100 μm. D–F, Quantitative RT-PCR analysis of MCP-1, osteopontin, and CTGF mRNAs, respectively, in LV tissue of (1) control, (2) HF, (3) HYD, (4) OLM + AZE, and (5) APO groups. Data are means ± SEM for 6 rats of each group. RT-PCR, reverse transcription–polymerase chain reaction.

