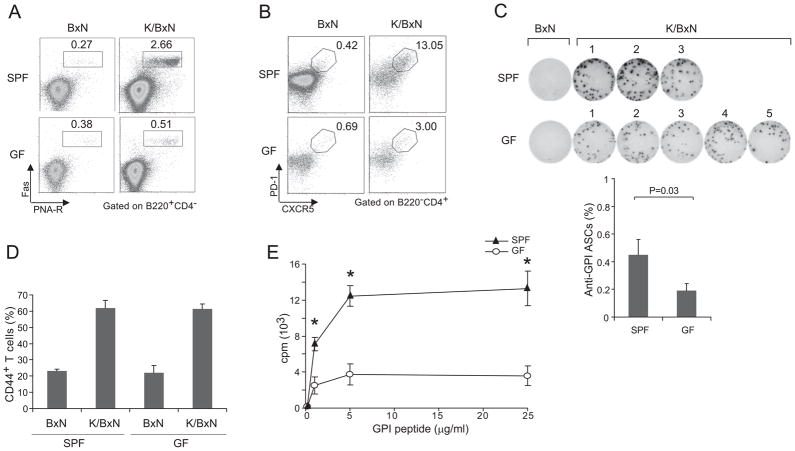
Figure 2. Impact of commensal flora on the B and T cell compartments of K/BxN mice.
(A) Splenocytes from GF or SPF BxN or K/BxN mice were stained with Abs recognizing B220, CD4, or FAS or with PNA-R, and were analyzed by flow cytometry, gating as indicated. Values indicate the percentages of Fas+PNA-R+ cells in total B cells. Data are representative of two independent experiments. (B) Splenocytes from GF or SPF BxN or K/BxN mice were stained with mAbs recognizing B220, CD4, CXCR5 and PD-1, and were analyzed by flow cytometry, gating as indicated. Values indicate the percentages of CXCR5+PD-1+ cells in total CD4+ T cells. Data are representative of two independent experiments. (C). Purified B cells of GF or SPF BxN or K/BxN mice were stimulated with GPI protein (10μg/ml) for 6 hrs. An ELISPOT assay revealed GPI-specific ASCs. Fraction of GPI-specific ASCs among total B cells; mean + s.e.m from two independent experiments. (D) Splenocytes were isolated from SPF or GF K/BxN mice, stained and analyzed by flow cytometry. The values indicate percentages of CD44+ cells in CD4+ T cells. Data are representative of two independent experiments [SPF BxN: 23.3 +/− 0.9 s.e.m. (n=2); SPF K/BxN: 61.8 +/− 4.8 s.e.m. (n=3); GF BxN: 22.1 +/− 4.5 s.e.m. (n=2); GF K/BxN: 61.3 +/− 3.2 s.e.m. (n=4)]. (E) Splenocytes were isolated from SPF and GF K/BxN mice and stimulated with GPI282–294 peptide at the indicated concentration. Data are representative of 2 independent experiments. Asterisks indicate statistical significance using the Student s t-Test, *P<0.05.

