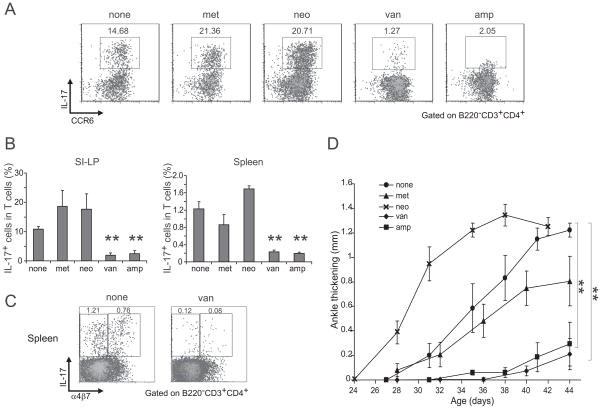
Figure 6. Effects of various antibiotics.
(A) Representative dot plots examining expression of IL-17 and CCR6 by SI-LP lymphocytes in untreated or the indicated antibiotic-treated SPF K/BxN mice, treated from birth to 5 wks of age. Values refer to % of the gated population in total CD4+ T cells. Representative of two independent experiments. (B) SPF K/BxN mice were treated with metronidazole (1g/l), neomycin (1g/l), vancomycin (0.5g/l) or ampicillin (1g/l) in the drinking water from birth. At 5 weeks of age, SI-LP lymphocytes (left) and splenocytes (right) were isolated, stained and analyzed by flow cytometry. Plotted are the % of IL-17+ cells of total CD4+ T cells. Mean + s.e. (data was a combination of two independent experiments with mice treated with metronidazole (n=4), neomycin (n=4), vacomycin (n=4), ampicillin (n=4) or nothing (n=8)) Asterisks indicate statistical significance using the Student s t-Test, **P<0.005. (C) Representative dot plots examining expression of α4β7 on IL-17-producing splenocytes in untreated (left) or vancomycin-treated (right) SPF K/BxN mice, treated from birth to 5 wks of age. Values refer to % of the gated population in total CD4+ T cells. Representative of two independent experiments. (D) K/BxN mice were untreated or were treated with metronidazole (1g/l), neomycin (1g/l), ampicillin (1g/L) or vancomycin (0.5g/l) in the drinking water from birth. Ankle thickening was followed from day 27. Mean ± s.e. (none group: n=5; all other antibiotics treated groups: n=4). Asterisks indicate statistical significance of area under curve using the Student s t-Test, **P<0.005. Representative of two independent experiments.

